VT-Dashboard
Dashboard
What is Dashboard?
Dashboard is data visualization tool that displaying various type of visual data in one place which also use to track, analyze the data by the stakeholders.
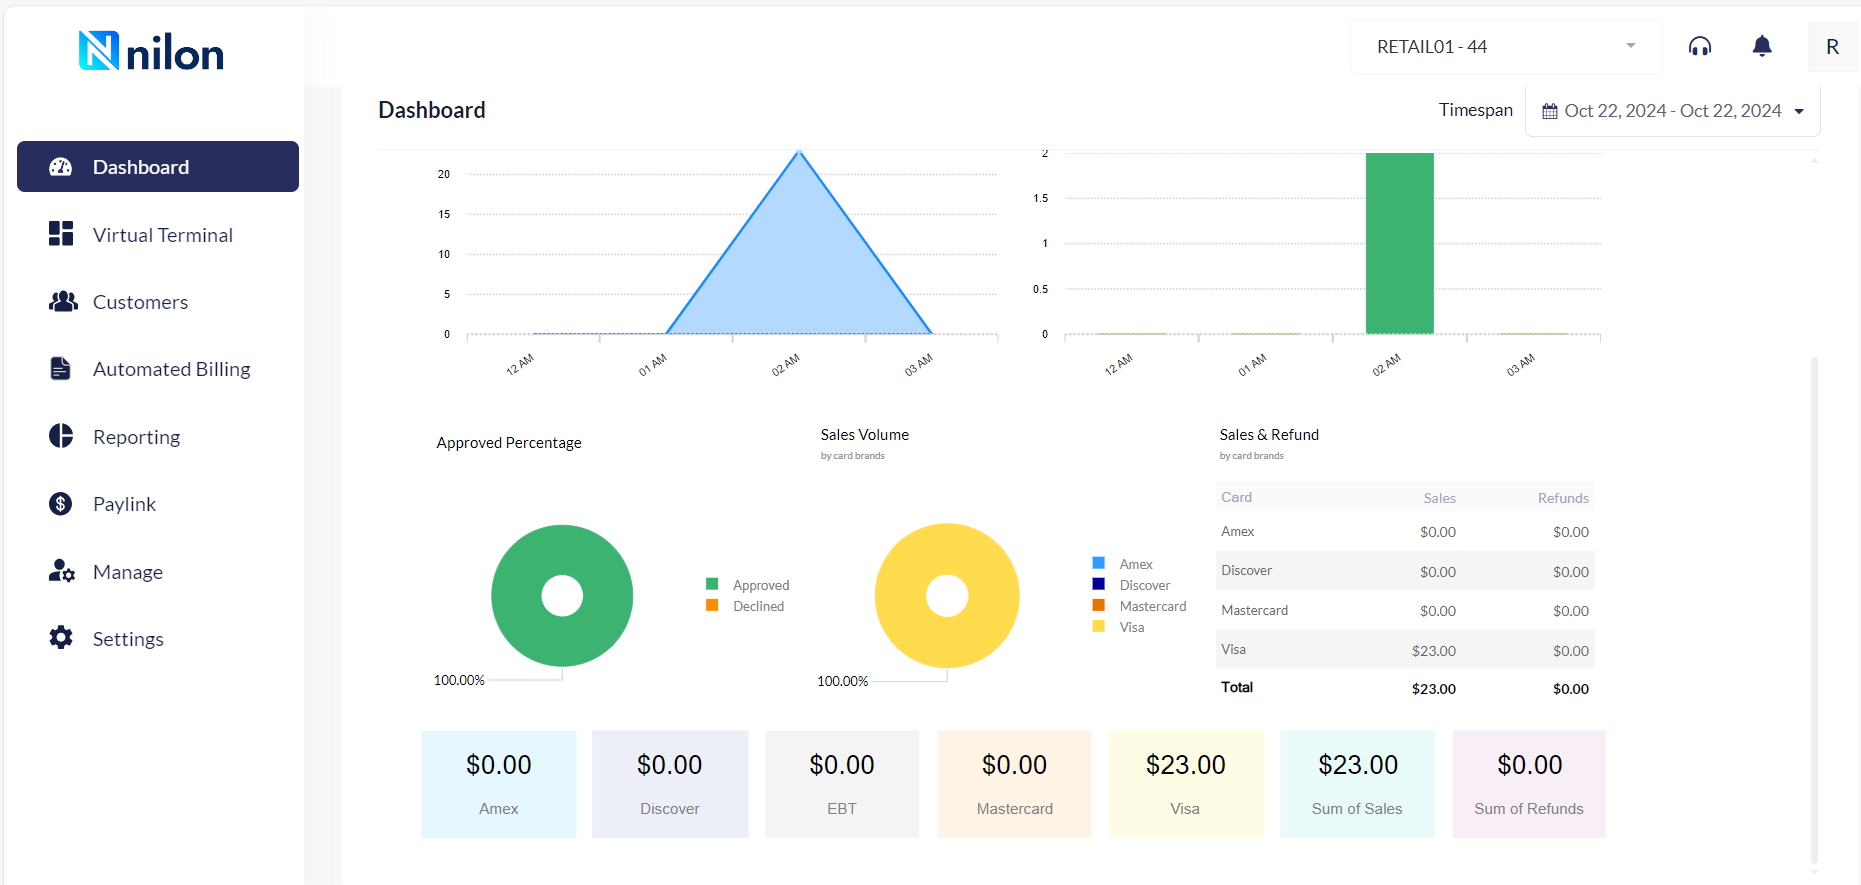
Virtual Terminal Dashboard
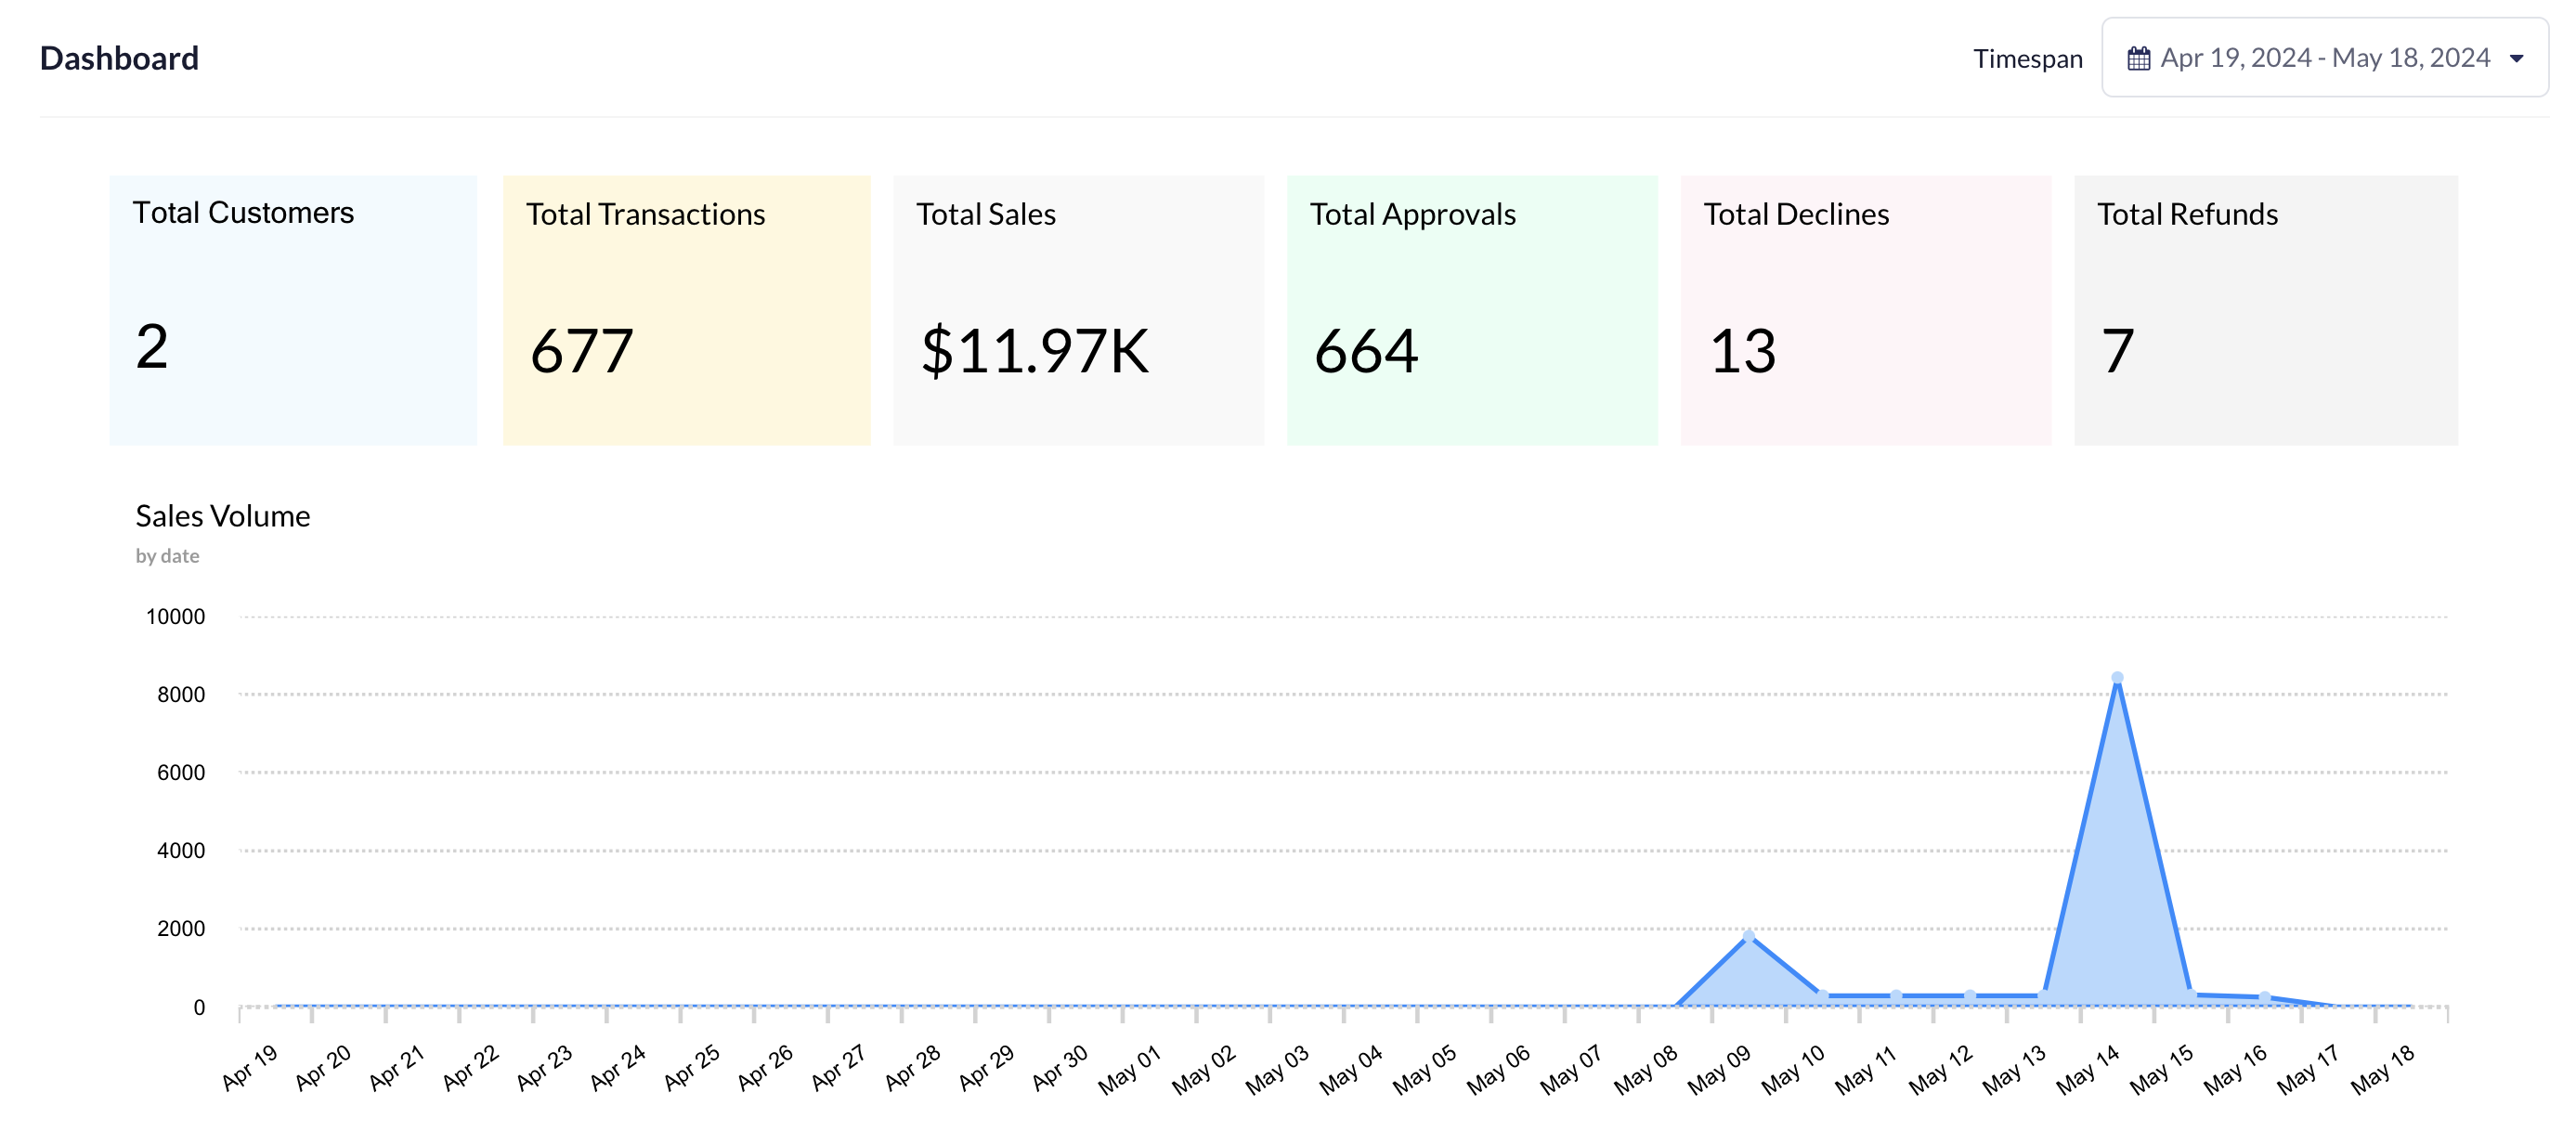
VT Dashboard shows the graphical report of various data, which is relevant to the customer, total Transaction, Total Sales, total Decline, total refunds over the Timespan like Today, Past 7 days, Past 30 Days, Past 12 Months and also display all the metrics. The Virtual Terminal dashboard shows data with respect to customers and the total transactions done by them.
Based on the Matrices, dashboard shows the data in Virtual Terminal
- Total Customer: Total Number of Customers in the Virtual Terminal.
- Total Transaction: No. of total transactions done on the Terminal
- Total Sales: Total no. of Sales done on the Terminal.
- Total Approvals: Total number of transactions approved on the Terminal.
- Total Declines: Total number of transactions approved on the Terminal.
- Total Refunds: Total number of refunds given to the Customers.
- Sales Volume: Graphical representation of the quantity of sales done through the transaction in a particular
timeperiod. - Sales Count: Graphical representation of the number of decline and approve sales done during the transaction
in a particular time period. - Approved Percentage: Shows the Pictorial representation of the data of % approval /decline of Transaction done
on the Terminal.
Following is the list of Dashboard metrices which the Virtual Terminal dashboard displays: -
Total Customers :Total Number of Customers in the Virtual Terminal.
Total Customers :Total Number of Customers in the Virtual Terminal
Total Transaction: No. of total transactions done on the Terminal
Total Sales: Total no. of Sales done on the Terminal.
Total Approvals: Total number of transactions approved on the Terminal.
Total Declines: Total number of transactions approved on the Terminal.
Total Refunds : Total number of refunds given to the Customers.
Sales Volume - Graphical representation of the quantity of sales done through the transaction in a particular time period.
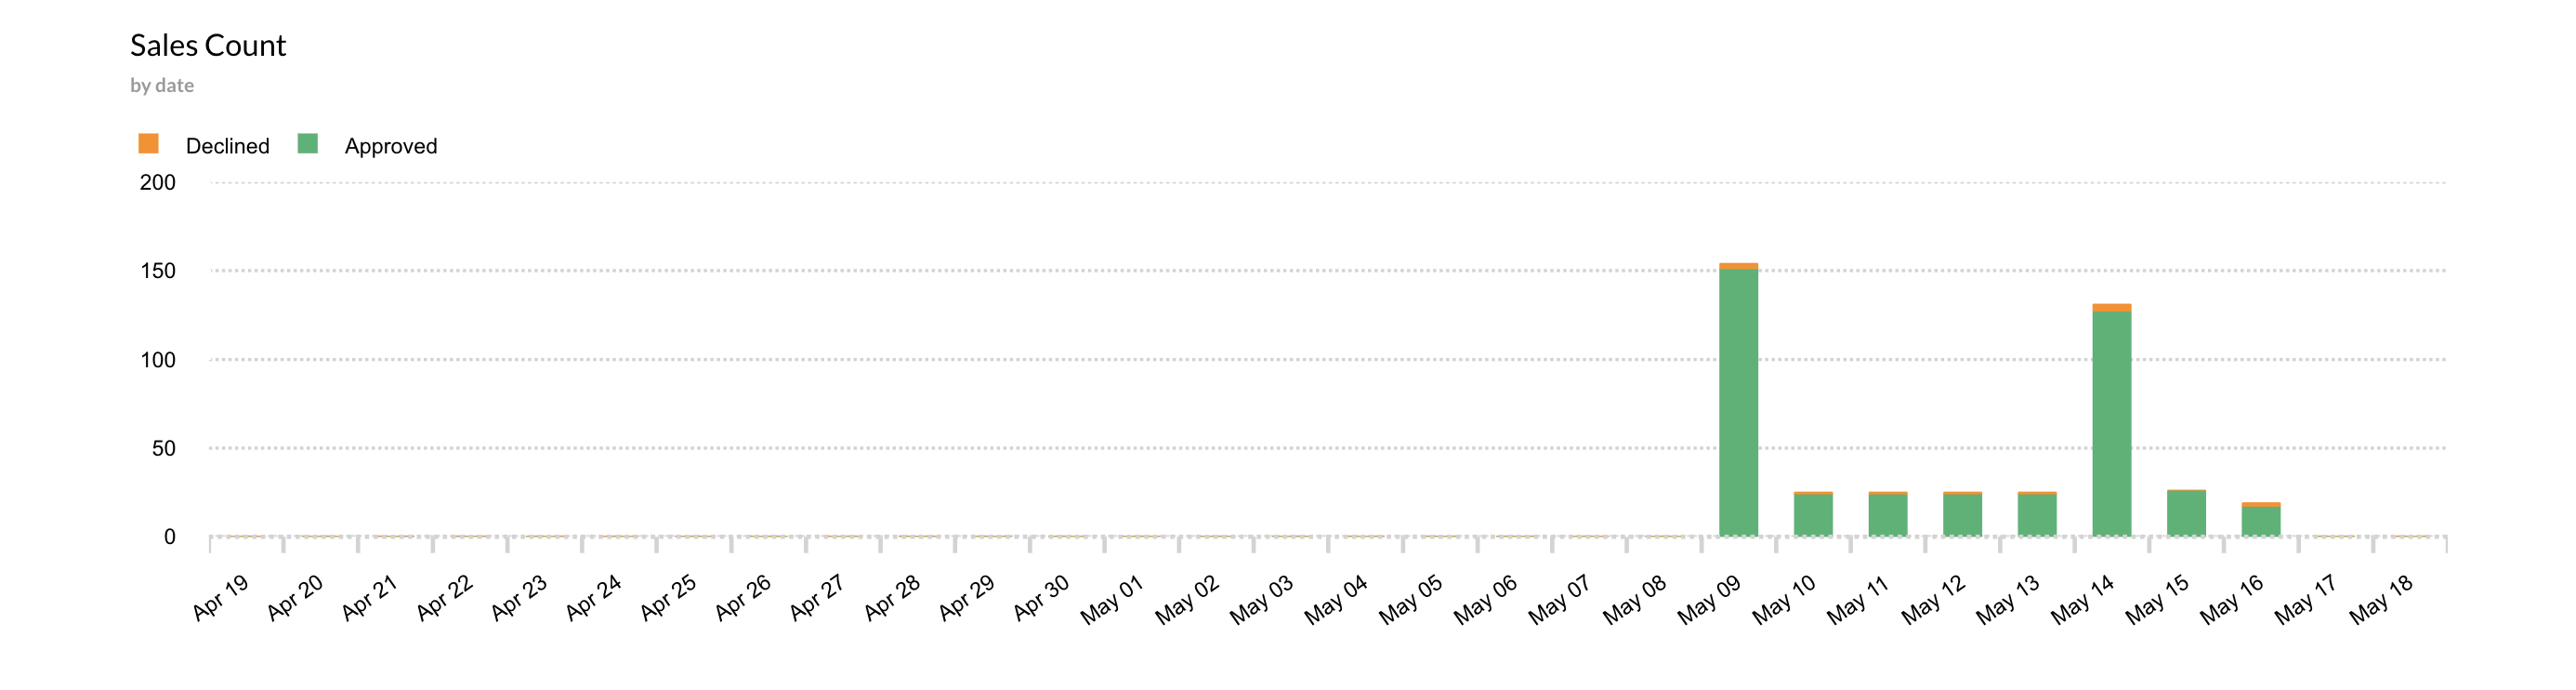
Sales Count - Graphical representation of the number of decline and approve sales done during the transaction in a particular time period.
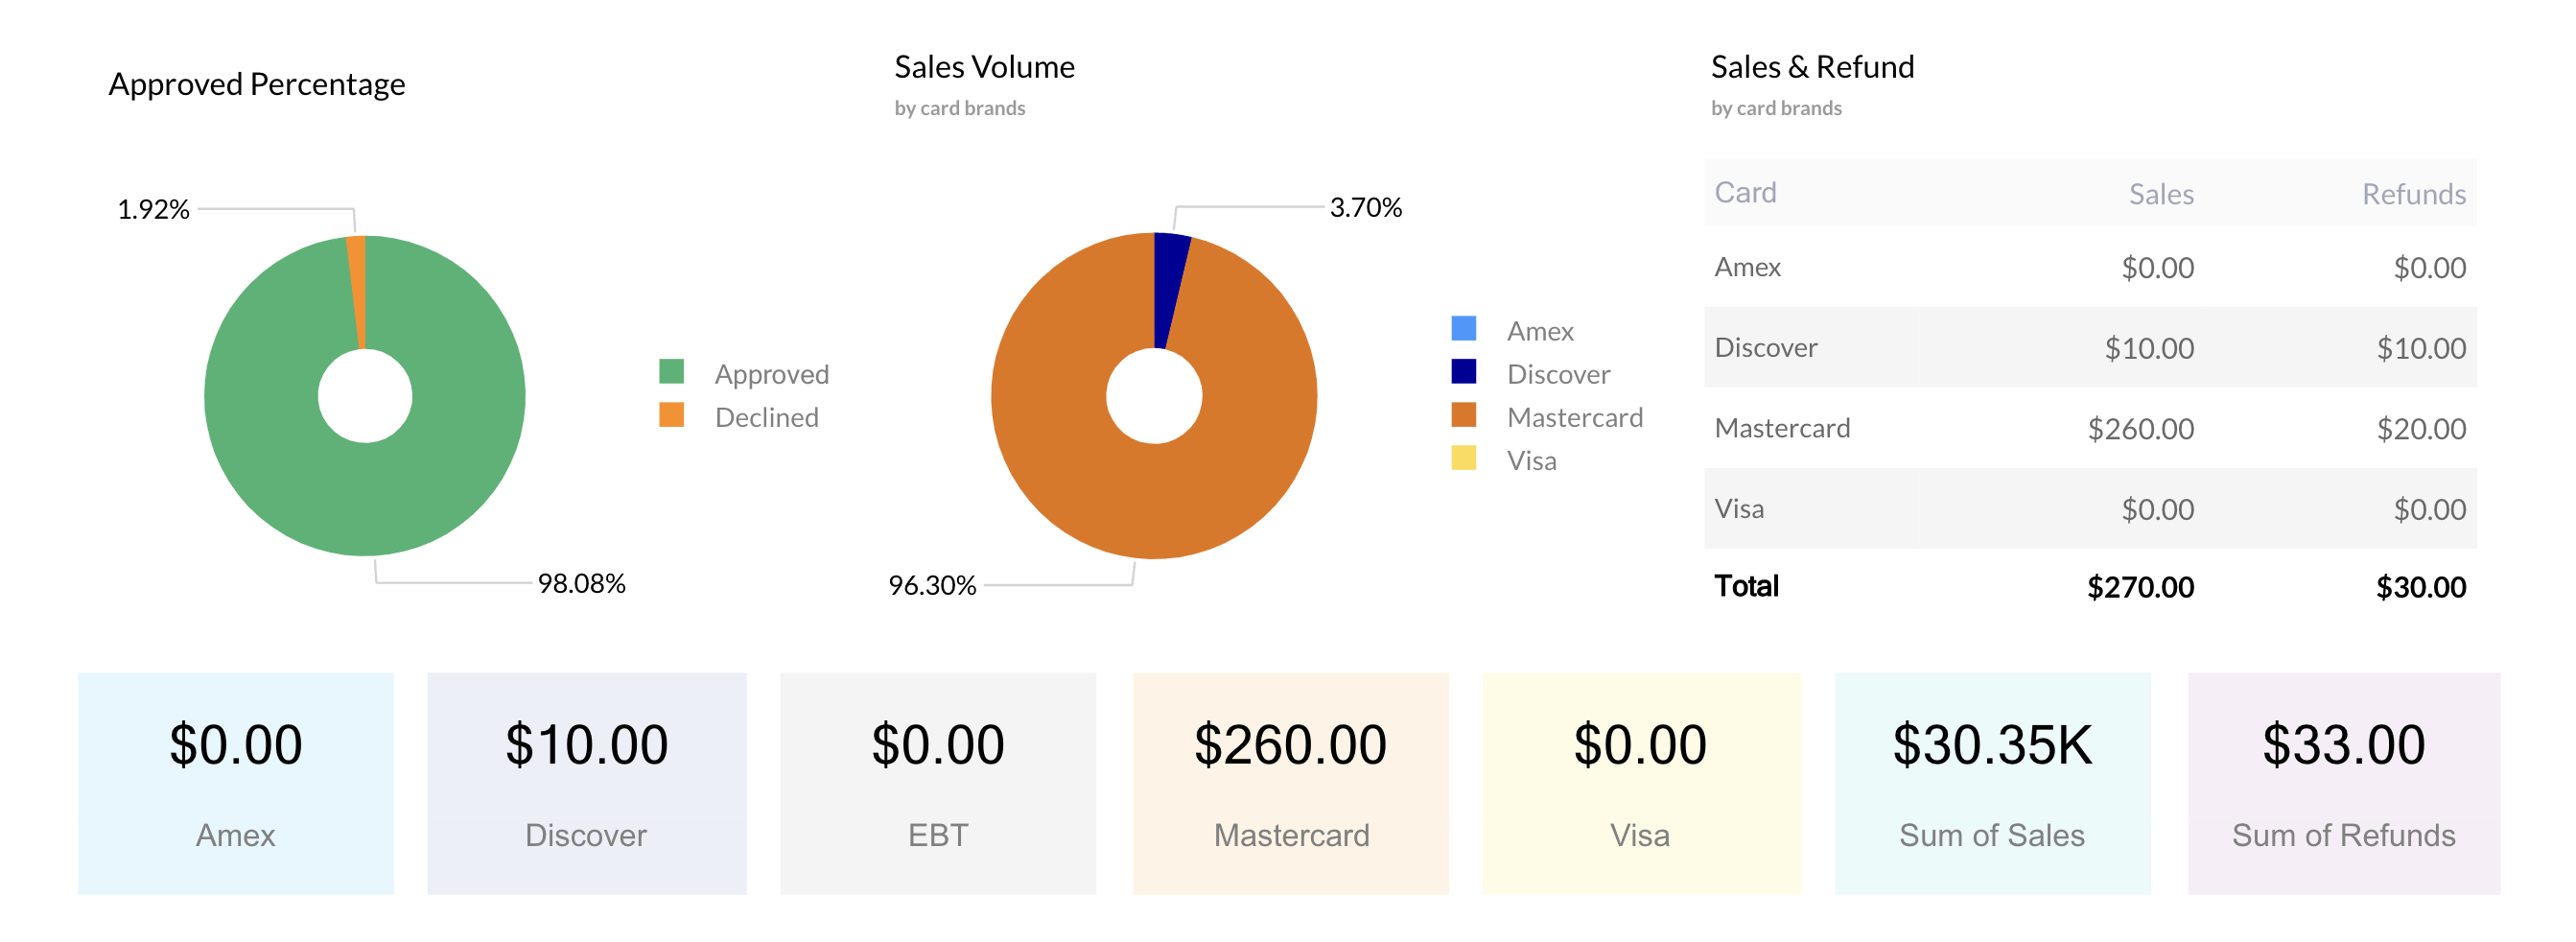
Approved Percentage: Shows the Pictorial representation of the data of % approval /decline of Transactions done on the Terminal.
Sales Volume: Quantity of Sales done through the various card on the Terminal.
Sales and Refund: Number of Sales and Refund done through the various card brands.
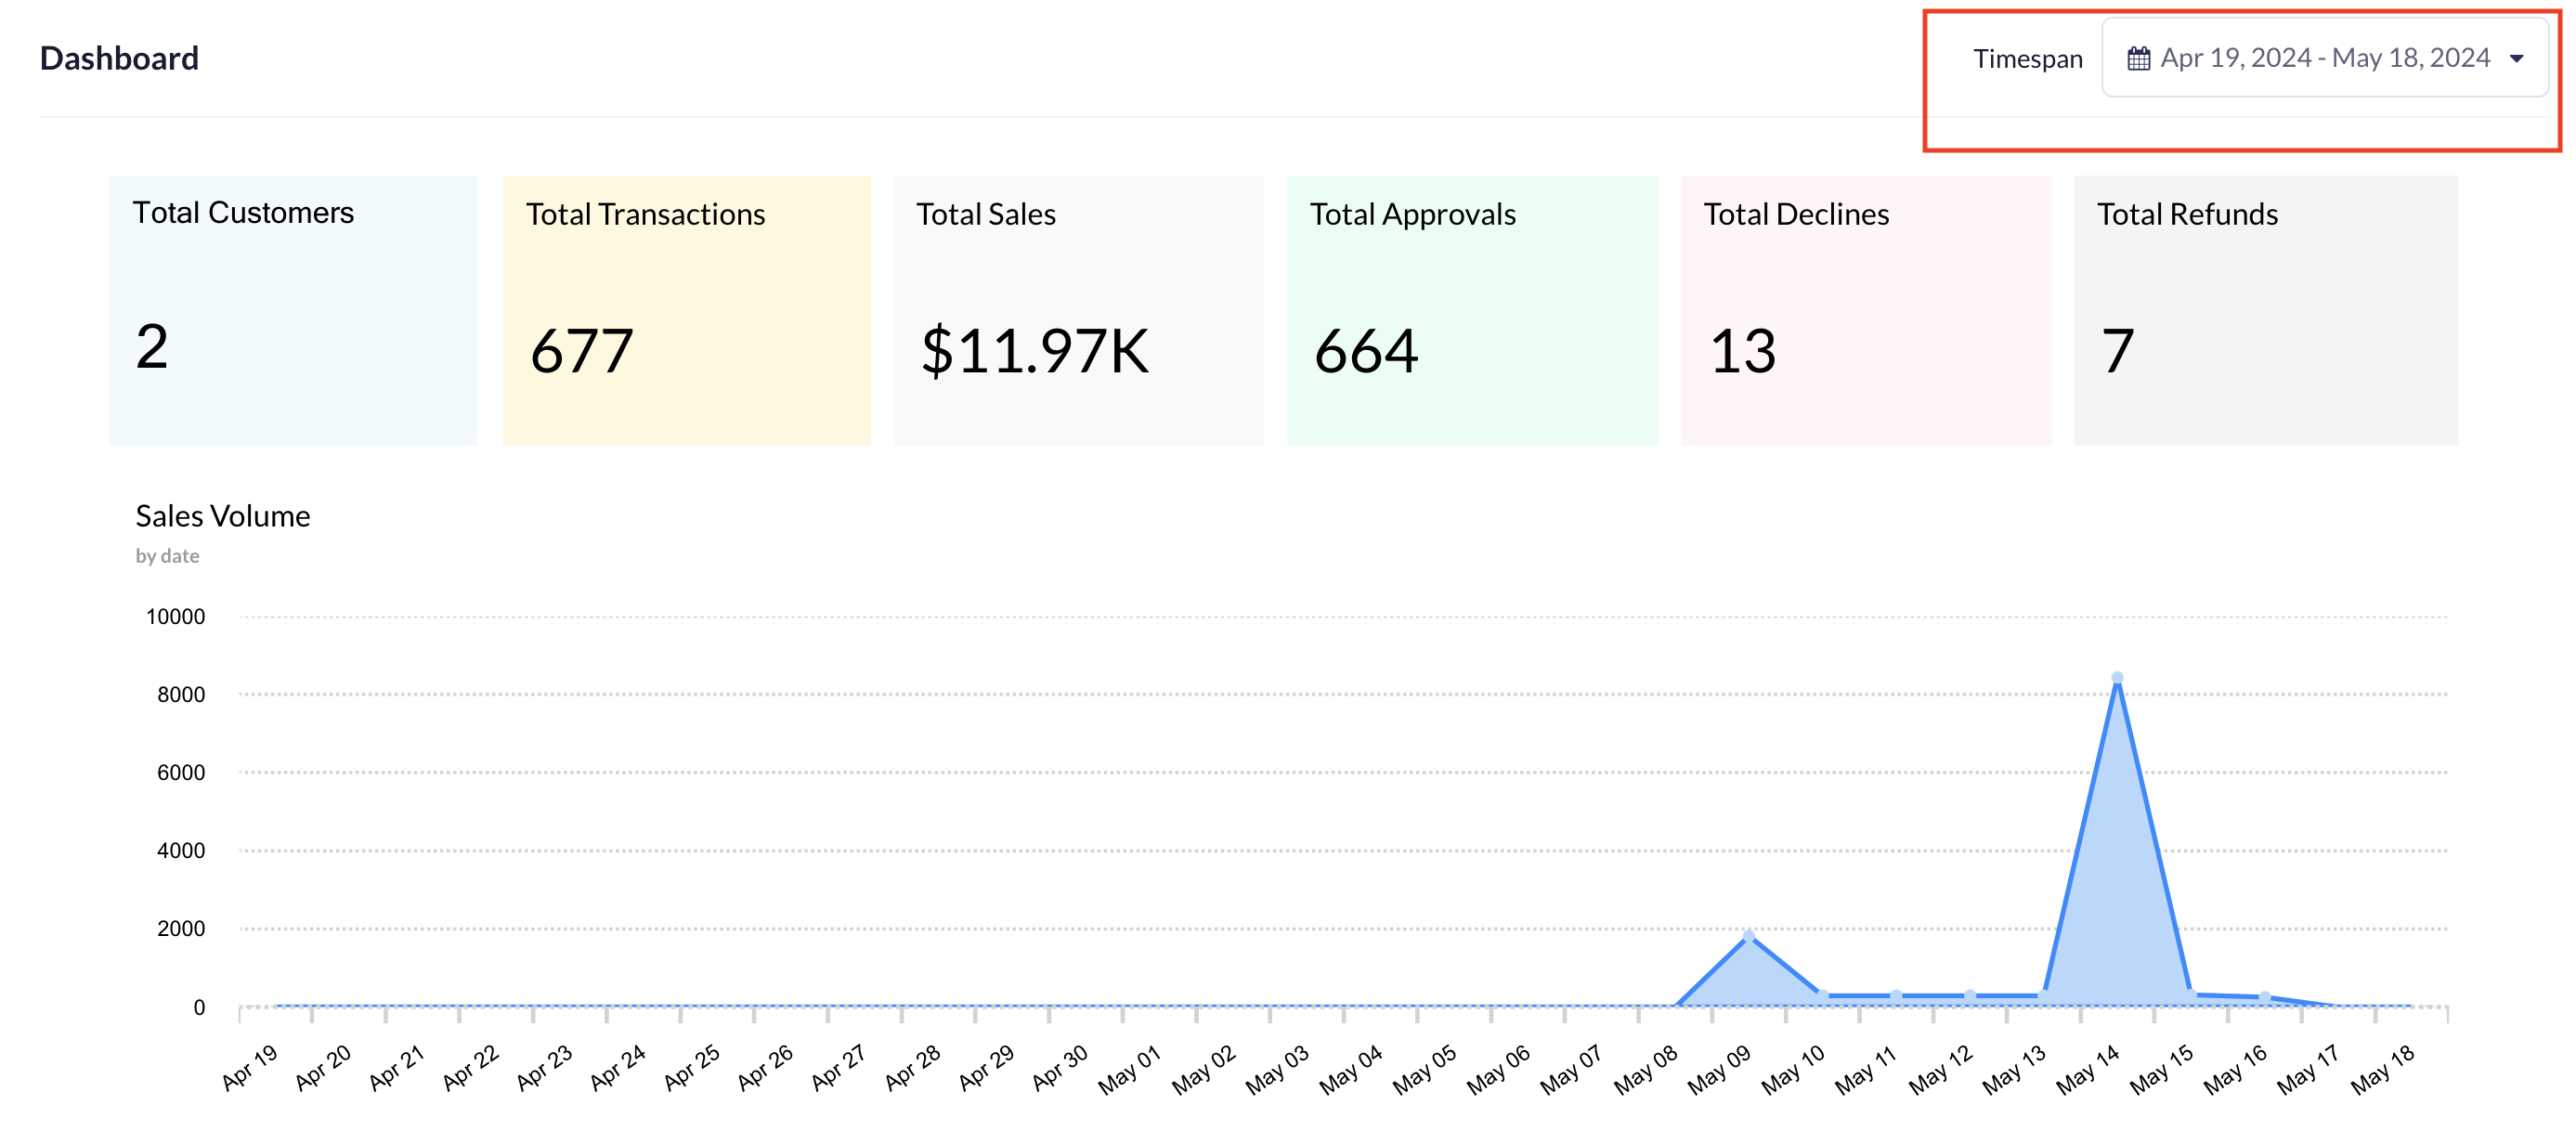
Timespan
Timespan: It is time period during which dashboard shows data with respect to customers and the total transactions done by them.
Timespan - For Today
Here the dashboard shows data of total customer, Transaction, sales, Approval, Declines & refund for Today.
Also, dashboard showing total sales volume, sales count, percentage of approved & decline transaction, sales and
refund done through the card for today.
Timespan for 7 days**
Here the dashboard shows data of total customer, Transaction, sales, Approval, Declines & refund of last7 days.
Also, dashboard showing total sales volume, sales count, percentage of approved & decline transaction, sales and
refund done through the card within 7 days.
Timespan for Past 30 Days
Here the dashboard shows data of total customer, Transaction, sales, Approval, Declines & refund of last 30 days.
Also, dashboard showing total sales volume, sales count, percentage of approved & decline transaction, sales and
refund done through the card within 30 Days.
Timespan for Past 12 months**
Here the dashboard shows data of total customer, Transaction, sales, Approval, Declines & refund of last 12 Months
Also, dashboard showing total sales volume, sales count, percentage of approved & decline transaction, sales and
refund done through the card within 12 Months.
Admin Dashboard
Admin dashboard view
Admin has a privilege to access the dashboard to track and analyze the data of Terminal, total sales and Refunds and also showing the transaction done from each card.
Admin can be able to look into the total sales and Refund done in the terminals and also can see the terminal-
wise transaction done through the various cards.
Terminal & sum of sales & sum of refund -It is showing the terminal -wise data of total refund and total sales.
Terminal visa merchant discover AmEx- It is showing the terminal -wise transaction data done through the
various cards.
Terminal: It is feature where a merchant has access to view the Terminal they are logged into.
User has the option to switch to a different terminal by accessing the Dropdown. Once the user clicks on any Terminal through the dropdown, they can access the chosen terminal.
Here admin can change the select the terminal and see the transaction done in the terminal and done through the various cards.

Updated over 1 year ago